pie-chart3dサンプル1
pie-chart3dサンプル1(『<biz-Stream_home>/sample/xml/pie-chart3d/pie-chart3dSample1.xml 』)
』)
<?xml version="1.0" encoding="UTF-8"?>
<!-- XML file created by biz-Stream Designer -->
<!-- biz-Stream Copyright BrainSellers.com Corp. -->
<Layout Width="160" Height="150" Unit="mm" xmlns:fo="http://www.w3.org/1999/XSL/Format" xmlns:bs="http://www.brainsellers.com/schema" xmlns:svg="http://www.brainsellers.com/schema" xmlns:form="http://www.brainsellers.com/schema" xmlns:pdf="http://www.brainsellers.com/schema" version="5.0.0">
    <pie-chart3d x="70" y="70" radius="50" font-family="MSGothic" font-size="10" font-style="ITALIC">
        <!-- セルpiechart1:領域の色指定 -->

        <pie-column background-color="255,0,0"/>

        <!-- セルpiechart2:領域の色指定 -->

        <pie-column background-color="0,255,0"/>

        <!-- セルpiechart3:領域の色指定 -->

        <pie-column background-color="0,0,255"/>

        <!-- セルpiechart4:領域の色指定 -->

        <pie-column background-color="255,0,255"/>

        <chart-body>
            <chart-row>
                <!-- セルのデータ指定 -->

                <chart-cell name="piechart1">20</chart-cell>
                <chart-cell name="piechart2">66</chart-cell>
                <chart-cell name="piechart3">81</chart-cell>
                <chart-cell name="piechart4">57</chart-cell>
            </chart-row>
        </chart-body>
    </pie-chart3d>
</Layout>
生成されるPDF(『<biz-Stream_home>/sample/xml/pie-chart3d/pie-chart3dSample1.pdf 』)
』)
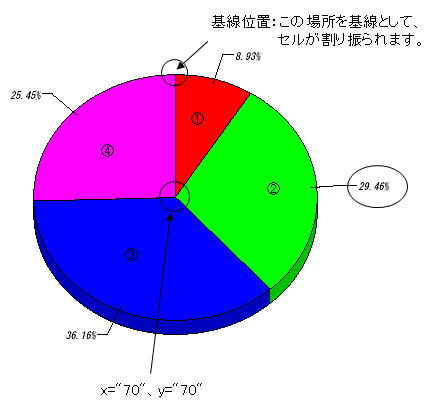
- ※各セルのパーセンテージラベルには、データ値の合計を100として割り出されたパーセンテージが表示されます。
(小数点第5位を四捨五入) - <各セルのデータ値とパーセンテージラベル>
- ※データ値合計:20+66+81+57=224
- ①piechart1: 20 ⇒20÷224=0.08928... (8.93%)
- ②piechart2: 66 ⇒66÷224=0.29464... (29.46%)
- ③piechart3: 81 ⇒81÷224=0.36160... (36.16%)
- ④piechart4: 57 ⇒57÷224=0.25446... (25.45%)