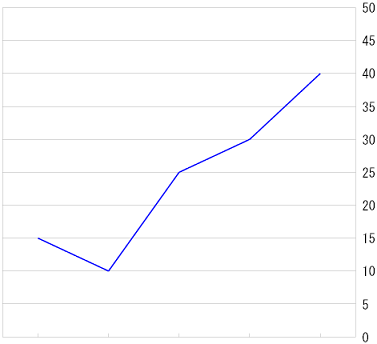
line-chart サンプル1
line-chartサンプル1(『
<biz-Stream_home>/sample/xml/line-chart/line-chartSample1.xml )』
)』
<?xml version="1.0" encoding="UTF-8"?>
<!-- XML file created by biz-Stream Designer -->
<!-- biz-Stream Copyright BrainSellers.com Corp. -->
<Layout Name="line-chartSample1_1" Width="200" Height="200" X="5" Y="5" xmlns:fo="http://www.w3.org/1999/XSL/Format" xmlns:bs="http://www.brainsellers.com/schema" xmlns:svg="http://www.brainsellers.com/schema" xmlns:form="http://www.brainsellers.com/schema" xmlns:pdf="http://www.brainsellers.com/schema" version="5.0.0">
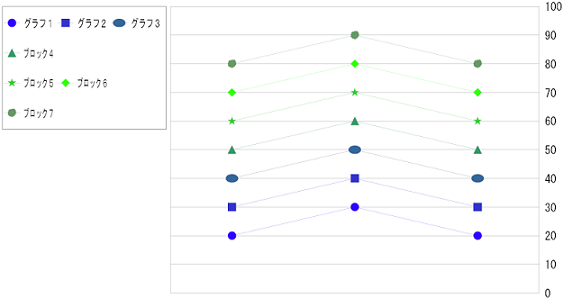
<!-- 折れ線グラフ -->
<line-chart x="40" height="70" border-x="false" border-y="true" scale="chain:true;font-style:PLAIN;frame:true;font-color:0,0,0;font-size:8;font-family:MSGothic;linestyle:Solid;line-width:0.0;gradient:false;shadow:false;line:10;">
<!-- 軸定義 -->
<chart-x-coordinate-axe name="x-axis" narrow="size"/>
<chart-y-coordinate-axe name="y-axis" narrow="none" format="##0" max="100" min="0" scale="style:right"/>
<!-- X軸間隔定義 -->
<chart-column column-width="30" display-line="true"/>
<chart-column column-width="30" display-line="true"/>
<chart-column column-width="30" display-line="true"/>
<!-- マーカー定義 -->
<line-column name="marker1" radius="1" border-color="51,0,255" marker="Circle" border-style="Solid" axis-name="y-axis"/>
<line-column name="marker2" radius="1" border-color="51,51,204" marker="Square" border-style="Solid" axis-name="y-axis"/>
<line-column name="marker3" radius="1" border-color="51,102,153" marker="Ellipse" border-style="Solid" axis-name="y-axis"/>
<line-column name="marker4" radius="1" border-color="51,153,102" marker="Triangle" border-style="Solid" axis-name="y-axis"/>
<line-column name="marker5" radius="1" border-color="51,204,51" marker="Star" border-style="Solid" axis-name="y-axis"/>
<line-column name="marker6" radius="1" border-color="51,255,0" marker="Diamond" border-style="Solid" axis-name="y-axis"/>
<line-column name="marker7" radius="1" border-color="102,153,102" marker="Cloud" border-style="Solid" axis-name="y-axis"/>
<!-- 凡例定義 -->
<chart-explanatory-notes width="40" height="30" border="true" line-color="0,0,0" line-width="0.1" position="left-top">
<chart-explanatory-notesrow>
<chart-explanatory-notescell marker-name="marker1">グラフ1</chart-explanatory-notescell>
<chart-explanatory-notescell marker-name="marker2">グラフ2</chart-explanatory-notescell>
<chart-explanatory-notescell marker-name="marker3">グラフ3</chart-explanatory-notescell>
</chart-explanatory-notesrow>
<chart-explanatory-notesrow>
<chart-explanatory-notescell marker-name="marker4">ブロック4</chart-explanatory-notescell>
</chart-explanatory-notesrow>
<chart-explanatory-notesrow>
<chart-explanatory-notescell marker-name="marker5">ブロック5</chart-explanatory-notescell>
<chart-explanatory-notescell marker-name="marker6">ブロック6</chart-explanatory-notescell>
</chart-explanatory-notesrow>
<chart-explanatory-notesrow>
<chart-explanatory-notescell marker-name="marker7">ブロック7</chart-explanatory-notescell>
</chart-explanatory-notesrow>
</chart-explanatory-notes>
<!-- マーカーのデータ値定義 -->
<chart-body>
<chart-row>
<chart-cell>20</chart-cell>
<chart-cell>30</chart-cell>
<chart-cell>40</chart-cell>
<chart-cell>50</chart-cell>
<chart-cell>60</chart-cell>
<chart-cell>70</chart-cell>
<chart-cell>80</chart-cell>
</chart-row>
<chart-row>
<chart-cell>30</chart-cell>
<chart-cell>40</chart-cell>
<chart-cell>50</chart-cell>
<chart-cell>60</chart-cell>
<chart-cell>70</chart-cell>
<chart-cell>80</chart-cell>
<chart-cell>90</chart-cell>
</chart-row>
<chart-row>
<chart-cell>20</chart-cell>
<chart-cell>30</chart-cell>
<chart-cell>40</chart-cell>
<chart-cell>50</chart-cell>
<chart-cell>60</chart-cell>
<chart-cell>70</chart-cell>
<chart-cell>80</chart-cell>
</chart-row>
</chart-body>
</line-chart>
</Layout>
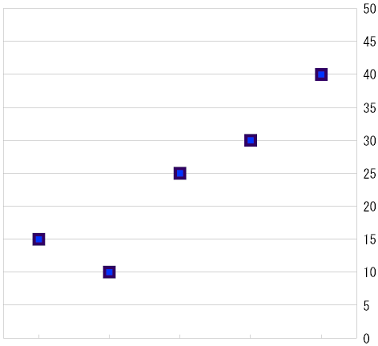
生成されるPDF(『
<biz-Stream_home>/sample/xml/line-chart/line-chartSample1.pdf )』
)』
<マーカーの大きさ指定方法>
- ①
shape="Ellipse"(楕円)の場合
・幅 = radius の指定値×1.5
・高さ = radius の指定値 - ②その他形状である場合
・幅 = radius の指定値×2
・高さ = radius の指定値×2