<?xml version="1.0" encoding="UTF-8"?>
<!-- XML file created by biz-Stream Designer -->
<!-- biz-Stream Copyright BrainSellers.com Corp. -->
<Layout Width="150mm" Height="120mm" xmlns:fo="http://www.w3.org/1999/XSL/Format" xmlns:bs="http://www.brainsellers.com/schema" xmlns:svg="http://www.brainsellers.com/schema" xmlns:form="http://www.brainsellers.com/schema" xmlns:pdf="http://www.brainsellers.com/schema" version="5.0.0">
<candle-chart x="15" y="25" unit="mm" height="70" background-color="255,255,153" border-x="true" border-y="true" upBorder-color="255,255,255" downBorder-color="0,0,0" scale="chain:true;font-style:PLAIN;style:left;frame:true;font-color:0,0,0;font-size:8;font-family:MSGothic;linestyle:Solid;line-width:0.0;gradient:false;shadow:false;line:10;">
<chart-x-coordinate-axe name="x-axe" unit-position="top" unit-value="日" narrow="size" border-width="0.1" border-color="0,0,0" scale="font-style:PLAIN;font-family:MSGothic;unitfont-color:0,0,0;unitfont-style:PLAIN;font-size:8;unitfont-size:8;unitfont-family:MSGothic;font-color:0,0,0;"/>
<chart-y-coordinate-axe name="y-axe_1" unit-position="top" unit-value="円" narrow="none" border-width="0.1" border-color="0,0,0" format="##0" max="1100" min="1000" basis="true" scale="font-style:PLAIN;style:left;font-color:0,0,0;font-size:8;font-family:MSGothic;unitfont-family:MSGothic;linestyle:Solid;unitfont-color:0,0,0;unitfont-size:8;line:10;"/>
<chart-column name="chartcolumn_1" column-width="29.104" display-line="false" use-area="60"/>
<chart-column name="chartcolumn_2" column-width="29.104" display-line="false" use-area="60"/>
<chart-column name="chartcolumn_3" column-width="29.104" display-line="false" use-area="60"/>
<chart-column name="chartcolumn_4" column-width="29.104" display-line="false" use-area="60"/>
<candle-column name="2004/02/01" radius="0" background-color="255,0,0" axis-name="y-axe_1"/>
<candle-column name="2004/02/02" radius="0" background-color="255,140,0" axis-name="y-axe_1"/>
<candle-column name="2004/02/03" radius="0" background-color="255,255,0" axis-name="y-axe_1"/>
<candle-column name="2004/02/04" radius="0" background-color="0,128,0" axis-name="y-axe_1"/>
<chart-body>
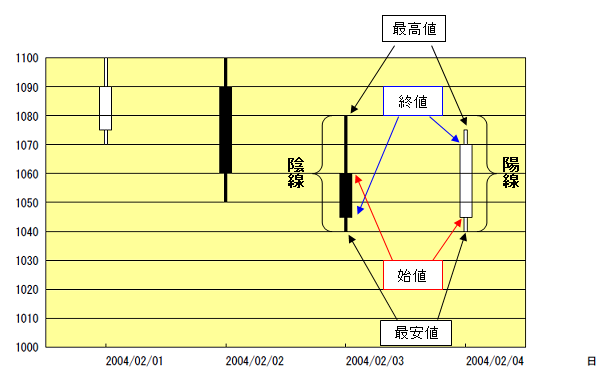
<!-- 最高値 -->
<chart-row>
<chart-cell name="candlecolumn_1_1">1100</chart-cell>
<chart-cell name="candlecolumn_2_1">1100</chart-cell>
<chart-cell name="candlecolumn_3_1">1080</chart-cell>
<chart-cell name="candlecolumn_4_1">1075</chart-cell>
</chart-row>
<!-- 最安値 -->
<chart-row>
<chart-cell name="candlecolumn_1_2">1070</chart-cell>
<chart-cell name="candlecolumn_2_2">1050</chart-cell>
<chart-cell name="candlecolumn_3_2">1040</chart-cell>
<chart-cell name="candlecolumn_4_2">1040</chart-cell>
</chart-row>
<!-- 始値 -->
<chart-row>
<chart-cell name="candlecolumn_1_3">1075</chart-cell>
<chart-cell name="candlecolumn_2_3">1090</chart-cell>
<chart-cell name="candlecolumn_3_3">1060</chart-cell>
<chart-cell name="candlecolumn_4_3">1045</chart-cell>
</chart-row>
<!-- 終値 -->
<chart-row>
<chart-cell name="candlecolumn_1_4">1090</chart-cell>
<chart-cell name="candlecolumn_2_4">1060</chart-cell>
<chart-cell name="candlecolumn_3_4">1045</chart-cell>
<chart-cell name="candlecolumn_4_4">1070</chart-cell>
</chart-row>
</chart-body>
</candle-chart>
</Layout>
 』)
』) 』)
』)