<?xml version="1.0" encoding="UTF-8"?>
<!-- XML file created by biz-Stream Designer -->
<!-- biz-Stream Copyright BrainSellers.com Corp. -->
<Layout Name="block-chartSample7" Width="150" Height="150" X="30" Y="30" xmlns:fo="http://www.w3.org/1999/XSL/Format" xmlns:bs="http://www.brainsellers.com/schema" xmlns:svg="http://www.brainsellers.com/schema" xmlns:form="http://www.brainsellers.com/schema" xmlns:pdf="http://www.brainsellers.com/schema" version="5.0.0">
<!-- 縦棒グラフ -->
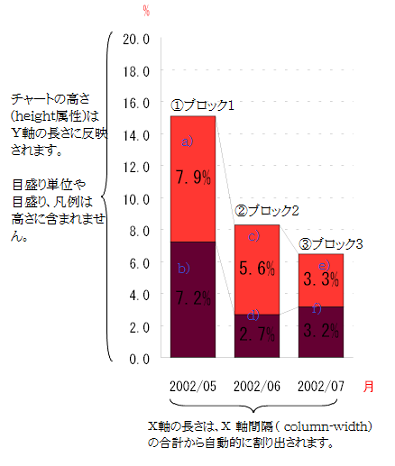
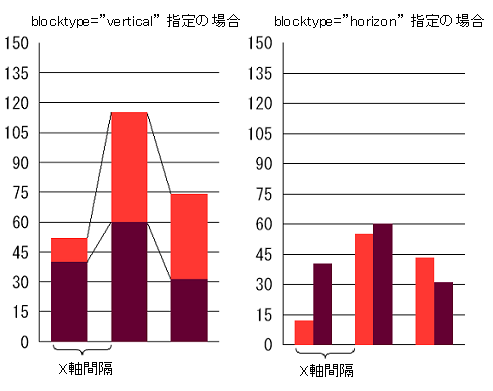
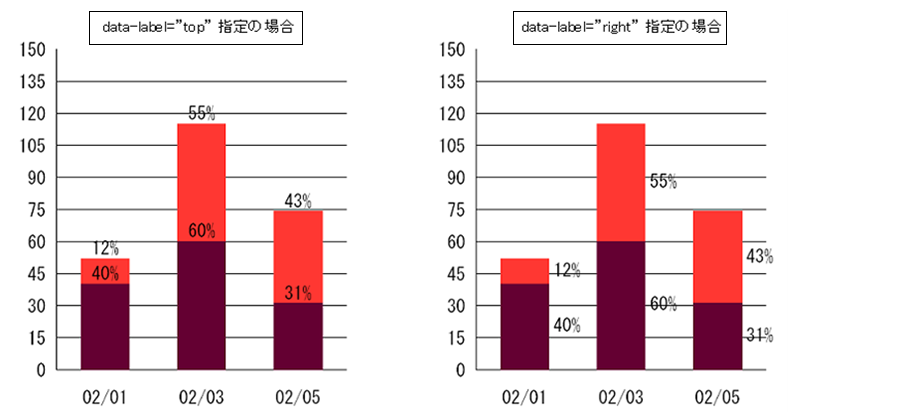
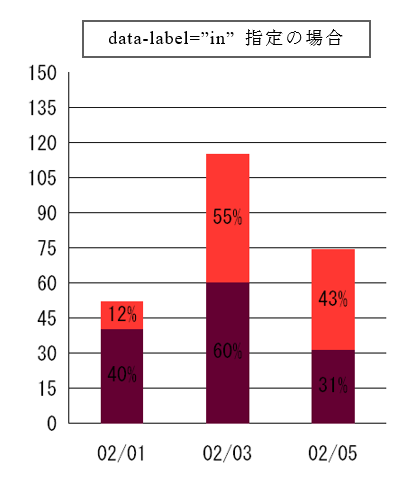
<block-chart x="2" y="2" height="80" border-x="true" border-y="false" block-type="vertical" data-label="in" type="stackbar" format="#,##0" display-label="false" data-narrow="false" scale="chain:none;font-style:PLAIN;frame:true;font-color:0,0,0;font-size:8;font-family:MSGothic;linestyle:Solid;line-width:0.0;gradient:false;shadow:false;line:10;">
<!-- 軸定義 -->
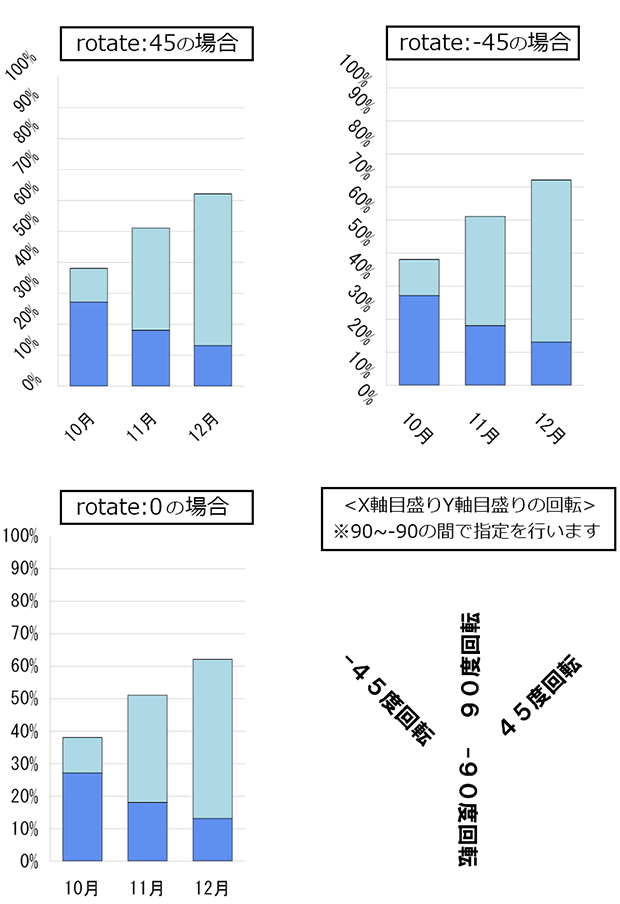
<chart-x-coordinate-axe name="x_axis" narrow="size" scale="style:none"/>
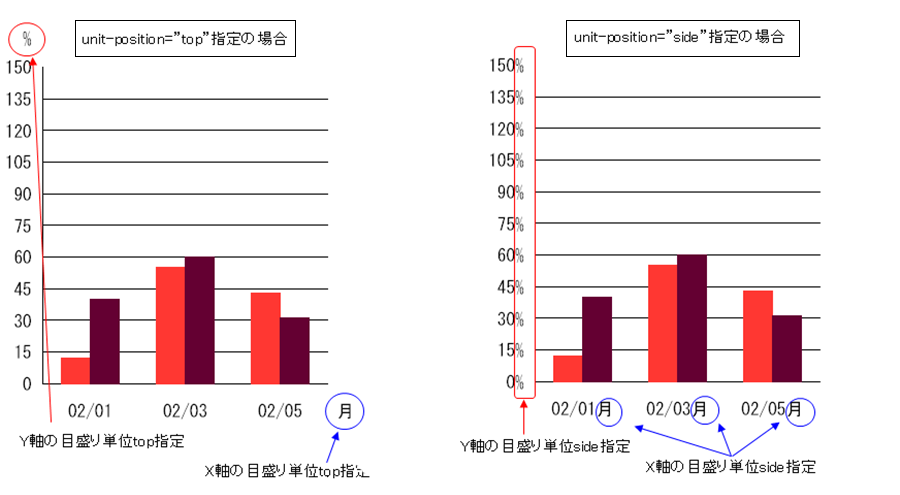
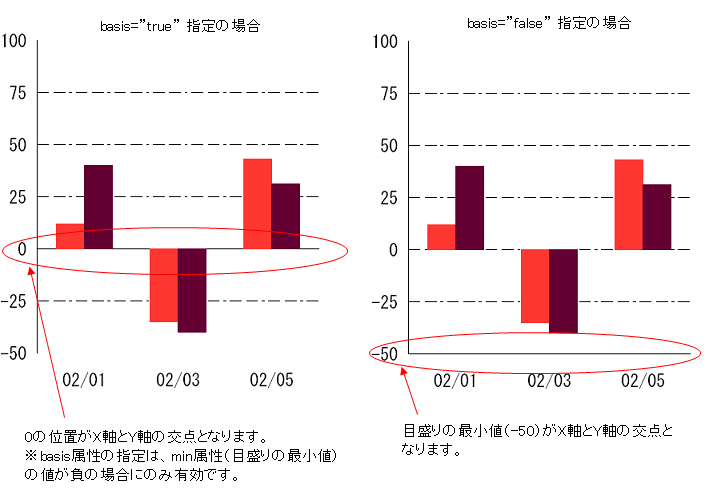
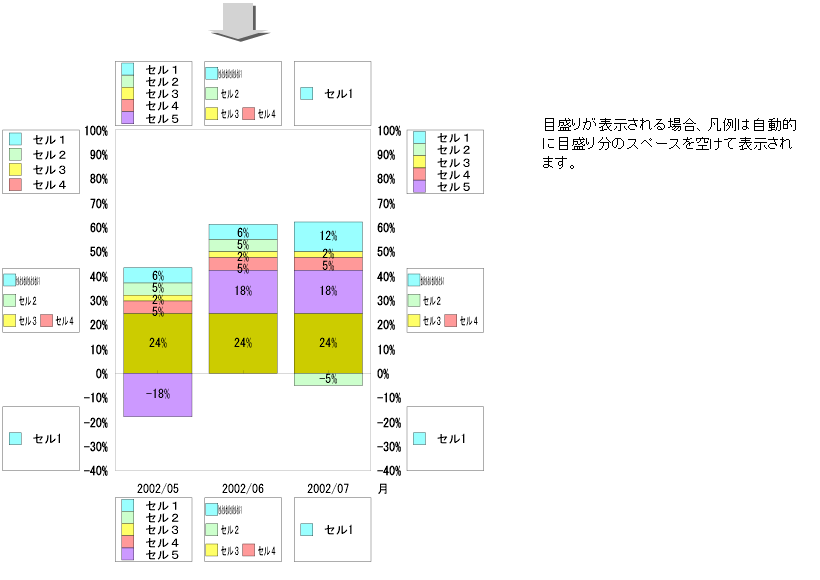
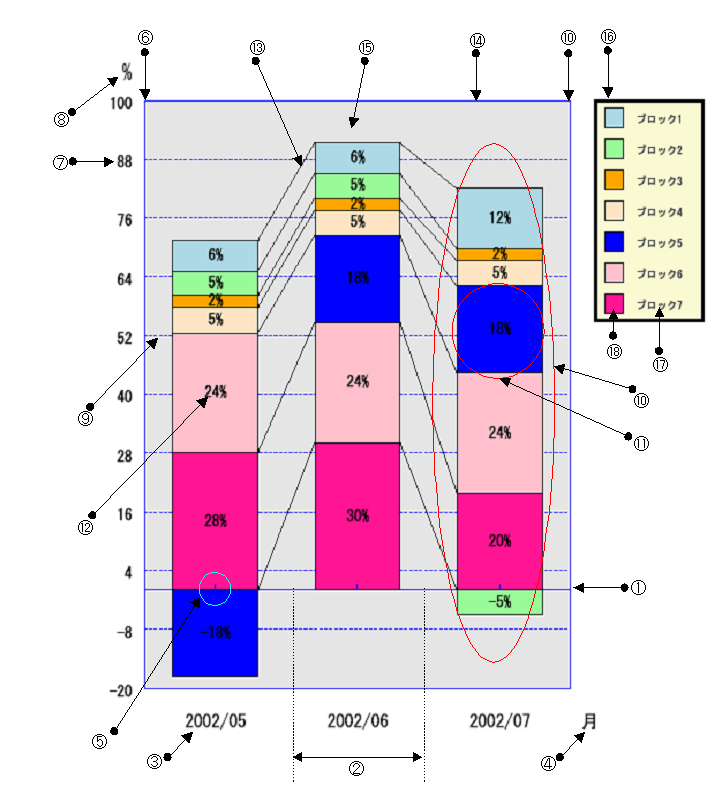
<chart-y-coordinate-axe name="y_axis1" unit-position="side" unit-value="%" narrow="none" format="##0" max="100" min="-40" basis="true" scale="line:14;style:none"/>
<!-- X軸間隔定義 -->
<chart-column column-width="20" display-line="true" use-area="80">2002/05</chart-column>
<chart-column column-width="20" display-line="true" use-area="80">2002/06</chart-column>
<chart-column column-width="20" display-line="true" use-area="80">2002/07</chart-column>
<!-- ブロックセル定義 -->
<block-column name="cell1" border-width="0.1" border-color="0,0,0" background-color="153,255,255" axis-name="y_axis1"/>
<block-column name="cell2" border-width="0.1" border-color="0,0,0" background-color="204,255,204" axis-name="y_axis1"/>
<block-column name="cell3" border-width="0.1" border-color="0,0,0" background-color="255,255,102" axis-name="y_axis1"/>
<block-column name="cell4" border-width="0.1" border-color="0,0,0" background-color="255,153,153" axis-name="y_axis1"/>
<block-column name="cell5" border-width="0.1" border-color="0,0,0" background-color="204,153,255" axis-name="y_axis1"/>
<block-column name="cell6" border-width="0.1" border-color="0,0,0" background-color="204,204,0" axis-name="y_axis1"/>
<!-- 凡例1(右上) -->
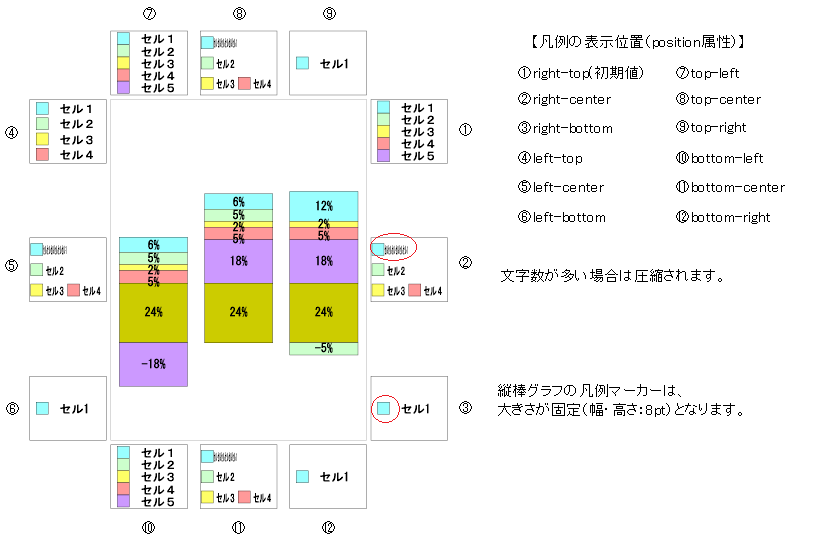
<chart-explanatory-notes width="18" height="15" border="true" line-color="0,0,0" line-width="0.1" position="right-top">
<chart-explanatory-notesrow>
<chart-explanatory-notescell marker-name="cell1">セル1</chart-explanatory-notescell>
</chart-explanatory-notesrow>
<chart-explanatory-notesrow>
<chart-explanatory-notescell marker-name="cell2">セル2</chart-explanatory-notescell>
</chart-explanatory-notesrow>
<chart-explanatory-notesrow>
<chart-explanatory-notescell marker-name="cell3">セル3</chart-explanatory-notescell>
</chart-explanatory-notesrow>
<chart-explanatory-notesrow>
<chart-explanatory-notescell marker-name="cell4">セル4</chart-explanatory-notescell>
</chart-explanatory-notesrow>
<chart-explanatory-notesrow>
<chart-explanatory-notescell marker-name="cell5">セル5</chart-explanatory-notescell>
</chart-explanatory-notesrow>
</chart-explanatory-notes>
<!-- 凡例2(右中央) -->
<chart-explanatory-notes width="18" height="15" border="true" line-color="0,0,0" line-width="0.1" position="right-center">
<chart-explanatory-notesrow>
<chart-explanatory-notescell marker-name="cell1">セルセルセルセルセルセル1</chart-explanatory-notescell>
</chart-explanatory-notesrow>
<chart-explanatory-notesrow>
<chart-explanatory-notescell marker-name="cell2">セル2</chart-explanatory-notescell>
</chart-explanatory-notesrow>
<chart-explanatory-notesrow>
<chart-explanatory-notescell marker-name="cell3">セル3</chart-explanatory-notescell>
<chart-explanatory-notescell marker-name="cell4">セル4</chart-explanatory-notescell>
</chart-explanatory-notesrow>
</chart-explanatory-notes>
<!-- 凡例3(右下) -->
<chart-explanatory-notes width="18" height="15" border="true" line-color="0,0,0" line-width="0.1" position="right-bottom">
<chart-explanatory-notesrow>
<chart-explanatory-notescell marker-name="cell1">セル1</chart-explanatory-notescell>
</chart-explanatory-notesrow>
</chart-explanatory-notes>
<!-- 凡例4(左上) -->
<chart-explanatory-notes width="18" height="15" border="true" line-color="0,0,0" line-width="0.1" position="left-top">
<chart-explanatory-notesrow>
<chart-explanatory-notescell marker-name="cell1">セル1</chart-explanatory-notescell>
</chart-explanatory-notesrow>
<chart-explanatory-notesrow>
<chart-explanatory-notescell marker-name="cell2">セル2</chart-explanatory-notescell>
</chart-explanatory-notesrow>
<chart-explanatory-notesrow>
<chart-explanatory-notescell marker-name="cell3">セル3</chart-explanatory-notescell>
</chart-explanatory-notesrow>
<chart-explanatory-notesrow>
<chart-explanatory-notescell marker-name="cell4">セル4</chart-explanatory-notescell>
</chart-explanatory-notesrow>
</chart-explanatory-notes>
<!-- 凡例5(左中央) -->
<chart-explanatory-notes width="18" height="15" border="true" line-color="0,0,0" line-width="0.1" position="left-center">
<chart-explanatory-notesrow>
<chart-explanatory-notescell marker-name="cell1">セルセルセルセルセルセル1</chart-explanatory-notescell>
</chart-explanatory-notesrow>
<chart-explanatory-notesrow>
<chart-explanatory-notescell marker-name="cell2">セル2</chart-explanatory-notescell>
</chart-explanatory-notesrow>
<chart-explanatory-notesrow>
<chart-explanatory-notescell marker-name="cell3">セル3</chart-explanatory-notescell>
<chart-explanatory-notescell marker-name="cell4">セル4</chart-explanatory-notescell>
</chart-explanatory-notesrow>
</chart-explanatory-notes>
<!-- 凡例6(左下) -->
<chart-explanatory-notes width="18" height="15" border="true" line-color="0,0,0" line-width="0.1" position="left-bottom">
<chart-explanatory-notesrow>
<chart-explanatory-notescell marker-name="cell1">セル1</chart-explanatory-notescell>
</chart-explanatory-notesrow>
</chart-explanatory-notes>
<!-- 凡例7(上部左) -->
<chart-explanatory-notes width="18" height="15" border="true" line-color="0,0,0" line-width="0.1" position="top-left">
<chart-explanatory-notesrow>
<chart-explanatory-notescell marker-name="cell1">セル1</chart-explanatory-notescell>
</chart-explanatory-notesrow>
<chart-explanatory-notesrow>
<chart-explanatory-notescell marker-name="cell2">セル2</chart-explanatory-notescell>
</chart-explanatory-notesrow>
<chart-explanatory-notesrow>
<chart-explanatory-notescell marker-name="cell3">セル3</chart-explanatory-notescell>
</chart-explanatory-notesrow>
<chart-explanatory-notesrow>
<chart-explanatory-notescell marker-name="cell4">セル4</chart-explanatory-notescell>
</chart-explanatory-notesrow>
<chart-explanatory-notesrow>
<chart-explanatory-notescell marker-name="cell5">セル5</chart-explanatory-notescell>
</chart-explanatory-notesrow>
</chart-explanatory-notes>
<!-- 凡例8(上部中央) -->
<chart-explanatory-notes width="18" height="15" border="true" line-color="0,0,0" line-width="0.1" position="top-center">
<chart-explanatory-notesrow>
<chart-explanatory-notescell marker-name="cell1">セルセルセルセルセルセル1</chart-explanatory-notescell>
</chart-explanatory-notesrow>
<chart-explanatory-notesrow>
<chart-explanatory-notescell marker-name="cell2">セル2</chart-explanatory-notescell>
</chart-explanatory-notesrow>
<chart-explanatory-notesrow>
<chart-explanatory-notescell marker-name="cell3">セル3</chart-explanatory-notescell>
<chart-explanatory-notescell marker-name="cell4">セル4</chart-explanatory-notescell>
</chart-explanatory-notesrow>
</chart-explanatory-notes>
<!-- 凡例9(上部右) -->
<chart-explanatory-notes width="18" height="15" border="true" line-color="0,0,0" line-width="0.1" position="top-right">
<chart-explanatory-notesrow>
<chart-explanatory-notescell marker-name="cell1">セル1</chart-explanatory-notescell>
</chart-explanatory-notesrow>
</chart-explanatory-notes>
<!-- 凡例10(下部左) -->
<chart-explanatory-notes width="18" height="15" border="true" line-color="0,0,0" line-width="0.1" position="bottom-left">
<chart-explanatory-notesrow>
<chart-explanatory-notescell marker-name="cell1">セル1</chart-explanatory-notescell>
</chart-explanatory-notesrow>
<chart-explanatory-notesrow>
<chart-explanatory-notescell marker-name="cell2">セル2</chart-explanatory-notescell>
</chart-explanatory-notesrow>
<chart-explanatory-notesrow>
<chart-explanatory-notescell marker-name="cell3">セル3</chart-explanatory-notescell>
</chart-explanatory-notesrow>
<chart-explanatory-notesrow>
<chart-explanatory-notescell marker-name="cell4">セル4</chart-explanatory-notescell>
</chart-explanatory-notesrow>
<chart-explanatory-notesrow>
<chart-explanatory-notescell marker-name="cell5">セル5</chart-explanatory-notescell>
</chart-explanatory-notesrow>
</chart-explanatory-notes>
<!-- 凡例11(下部中央) -->
<chart-explanatory-notes width="18" height="15" border="true" line-color="0,0,0" line-width="0.1" position="bottom-center">
<chart-explanatory-notesrow>
<chart-explanatory-notescell marker-name="cell1">セルセルセルセルセルセル1</chart-explanatory-notescell>
</chart-explanatory-notesrow>
<chart-explanatory-notesrow>
<chart-explanatory-notescell marker-name="cell2">セル2</chart-explanatory-notescell>
</chart-explanatory-notesrow>
<chart-explanatory-notesrow>
<chart-explanatory-notescell marker-name="cell3">セル3</chart-explanatory-notescell>
<chart-explanatory-notescell marker-name="cell4">セル4</chart-explanatory-notescell>
</chart-explanatory-notesrow>
</chart-explanatory-notes>
<!-- 凡例12(下部右) -->
<chart-explanatory-notes width="18" height="15" border="true" line-color="0,0,0" line-width="0.1" position="bottom-right">
<chart-explanatory-notesrow>
<chart-explanatory-notescell marker-name="cell1">セル1</chart-explanatory-notescell>
</chart-explanatory-notesrow>
</chart-explanatory-notes>
<!-- ブロックセルのデータ定義 -->
<chart-body>
<chart-row>
<chart-cell name="c1">6.3</chart-cell>
<chart-cell name="c2">5.0</chart-cell>
<chart-cell name="c3">2.4</chart-cell>
<chart-cell name="c4">5.2</chart-cell>
<chart-cell name="c5">-17.8</chart-cell>
<chart-cell name="c6">24.5</chart-cell>
</chart-row>
<chart-row>
<chart-cell name="c1">6.3</chart-cell>
<chart-cell name="c2">5.0</chart-cell>
<chart-cell name="c3">2.4</chart-cell>
<chart-cell name="c4">5.2</chart-cell>
<chart-cell name="c5">17.8</chart-cell>
<chart-cell name="c6">24.5</chart-cell>
</chart-row>
<chart-row>
<chart-cell name="c1">12.3</chart-cell>
<chart-cell name="c2">-5.0</chart-cell>
<chart-cell name="c3">2.4</chart-cell>
<chart-cell name="c4">5.2</chart-cell>
<chart-cell name="c5">17.8</chart-cell>
<chart-cell name="c6">24.5</chart-cell>
</chart-row>
</chart-body>
</block-chart>
</Layout>
 』)
』) 』)
』)